Satellite irradiance forecasting: one cell, a patch or the whole field
A satellite sees the irradiance of a whole region every hour. It is tempting to give a forecaster the whole map. Holding the forecaster fixed and changing only what it reads shows how much of that map actually helps.
Cyril Voyant (Mines Paris – PSL, Centre O.I.E.), with Andreas Kazantzidis (University of Patras) and Jan Kleissl (University of California San Diego) · manuscript in preparation, open code and data extract
In brief
- Every model forecasts the next 24 hourly values of one satellite cell over Corsica from its 24 past values; only what it reads changes: its own cell, a patch, the whole field, or a compressed field.
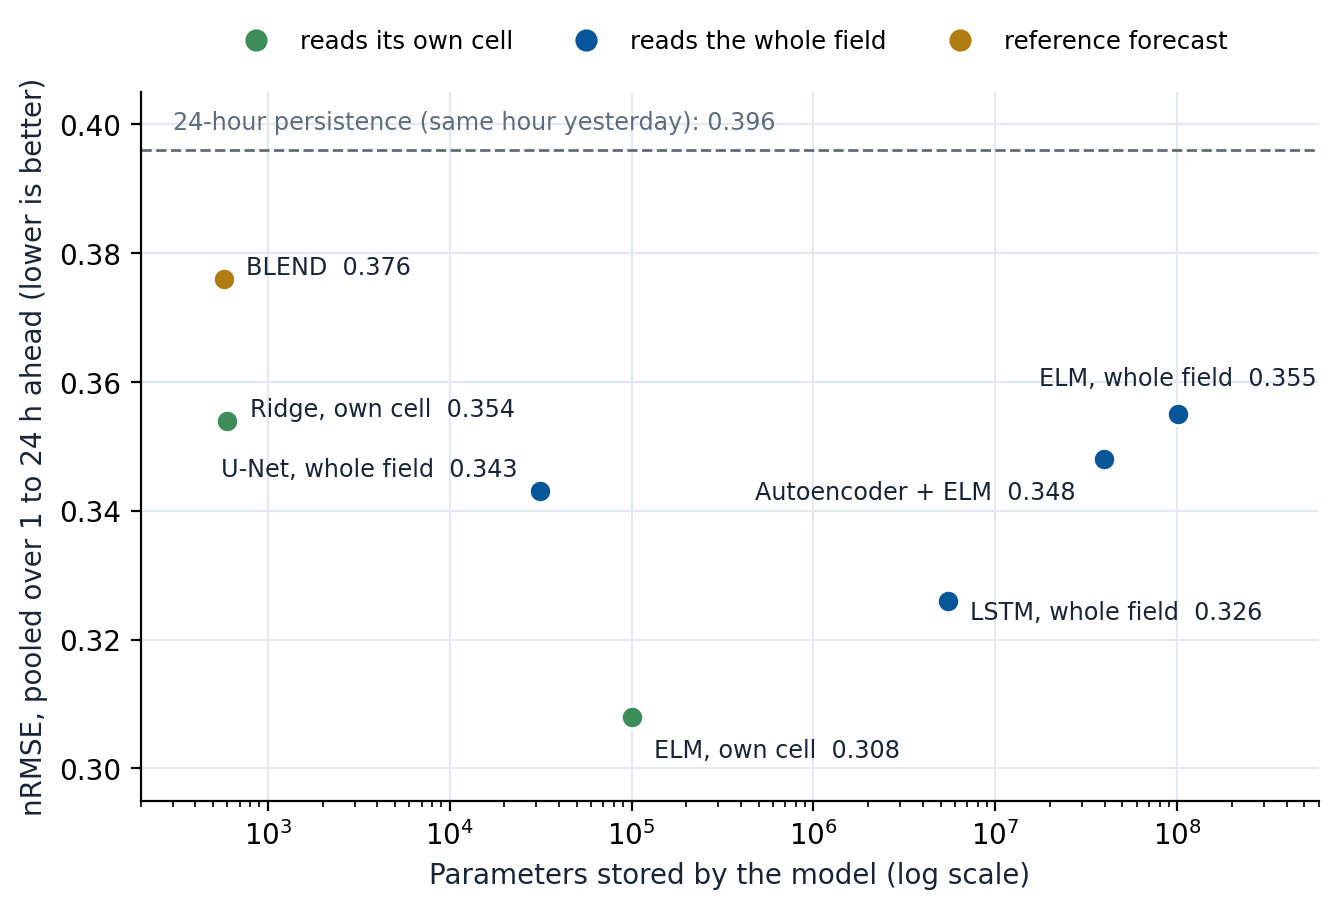
- In the public repository, an extreme learning machine reading its own cell has the lowest pooled error (nRMSE 0.308), ahead of the same model reading the whole field (0.355) with a thousand times fewer parameters, and of a U-Net (0.343) and an LSTM (0.326) reading the field.
- It is one region, one satellite product and one two-year split: a benchmark result, not a general law.
The finding
On this record, the hourly history of the cell itself carries most of what an hour-by-hour forecast of the next day can use. Reading the rest of the map adds parameters faster than it removes error: none of the seven compression methods tested and neither of the two deep networks reading the whole field reaches the per-cell model.
The question
Satellite irradiance comes as maps. Deep networks such as U-Nets and LSTMs read whole fields; compression methods shrink the field before a model reads it. Both add inputs and parameters. How much of that spatial information lowers the error of a forecast for each of the next 24 hours, and at what cost in stored parameters?
The theory, in plain words
One forecaster, several inputs. The forecaster is an extreme learning machine (ELM): a hidden layer of neurons drawn at random and never trained, and output weights fitted in one linear least-squares solve. Training takes seconds and the number of stored parameters is easy to count. The same forecaster reads either its own cell, a 3 × 3 patch, the whole field of 722 cells, or the field compressed by one of seven methods (Radon transform, DCT, wavelets, PCA, random projection, subsampling, autoencoder).
Fair references. Persistence repeats the last hour, the 24-hour persistence repeats the same hour of the previous day, and BLEND mixes the two. A model is worth its parameters only if it beats them.
Fair scoring. Errors are pooled over all cells, all lead times from 1 to 24 hours and all test hours where the Sun is more than 5° above the horizon. The nRMSE is divided by the mean scored observation of the test year, 407.9 W/m².
The example in figures
The data are HelioClim-3 irradiance (Heliosat-2 method, Meteosat images, SoDa service) on 1,148 points over Corsica, hourly, with 2005 for training and 2006 for testing.
- The per-cell ELM reaches nRMSE 0.308 with about 100 thousand stored parameters; the whole-field ELM reaches 0.355 with about 100 million.
- In W/m²: 0.308 × 407.9 ≈ 126 W/m² against about 145 W/m² for the whole-field ELM.
- A 3 × 3 patch does not help either (0.3087 against 0.3077 for a single cell).
- The 24-hour persistence scores 0.396, BLEND 0.376: every learned model beats them.
What it brings, and its limits
- Brings: a protocol where only the input changes, so that the value of spatial information is measured, not assumed; a parameter count next to every error, in line with the frugal approach; code that rebuilds the tables in seconds.
- Limits: one region, one satellite product (HelioClim-3), hourly steps and a single 2005/2006 split. Intra-hour nowcasting driven by cloud motion can behave differently. The manuscript is in preparation; only the numbers of the public repository are reported here.
Go further
- Full theory, equations, results table and code: the technical guide
- Code and data extract: github.com/cyrilvoyant/cell-vs-field-irradiance · archive doi:10.5281/zenodo.23562557 · data HelioClim-3, SoDa service, under its terms of use
- Same idea elsewhere: MIMO-ELM, seven energy signals of Corsica forecast by one model · how much model is enough?
- The approach behind this work: Understand before you compute