Simulate what you cannot yet measure: the electricity demand of road tunnels
A tunnel's operator rarely has detailed load measurements, especially at the design stage. The Tunnel Load Simulator builds the demand from what is known about the tunnel, says how uncertain it is, and states its limits.
Haytham El-Houari and Cyril Voyant · SmartTunnel project, Université Sidi Mohamed Ben Abdellah (Fès) and Mines Paris – PSL
In brief
- With no measurements at all, the electricity demand of a road tunnel can be simulated from its geometry, traffic, lighting and ventilation: one year at 10-minute resolution in about 150 ms.
- For a 1.5 km peri-urban tunnel with two tubes, the public example gives a median of 3,233 MWh per year and a peak of 873 kW over 20 Monte Carlo runs.
- It is a first-order generator: calibrate it on measurements before any engineering use.
The finding
Where a tunnel has no measurements yet, no model can be trained or validated for it, but a great deal can be simulated. A simple model, whose every coefficient is visible, gives credible orders of magnitude, their variability, and the effect of each design choice, provided its assumptions are stated.
The question
How much electricity does a road tunnel use, hour by hour, and how uncertain is that figure? The answer matters for sizing connections, choosing lighting and ventilation technologies, or studying local energy storage. Measured series are rare and site-specific.
The theory, in plain words
The power drawn at each moment is the sum of four parts, plus a small random fluctuation:
- a fixed base (control, safety systems);
- auxiliaries (pumps, equipment), proportional to the tunnel's length and depth;
- lighting, which depends on daylight at the portals and on traffic;
- ventilation, which follows traffic with its morning and evening peaks, and increases with slope and altitude. It jumps during random pollution episodes and accidents.
Each year is simulated many times with different random draws (Monte Carlo). The result is a median and a P10–P90 band, rather than a single curve.
Where it sits on the complexity ladder
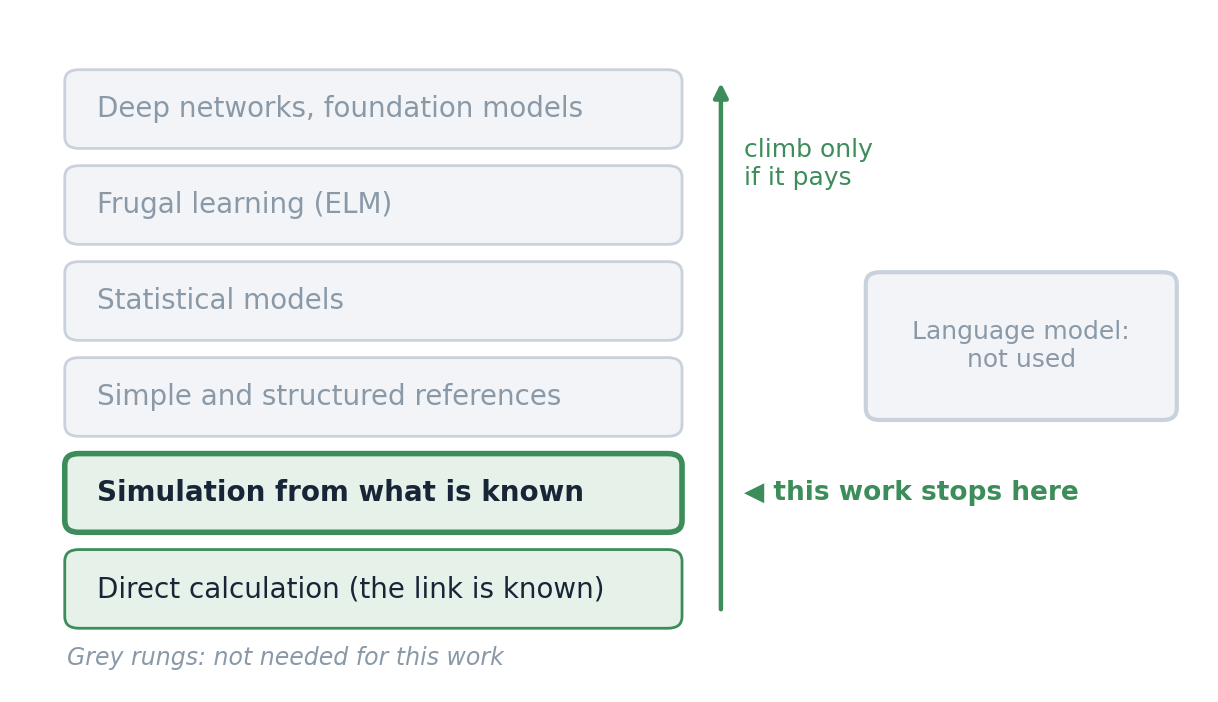
Second rung: simulation from what is known. Without local measurements, nothing can be calibrated or validated for this tunnel, and nothing is pretended: the parameters are engineering orders of magnitude, shown and adjustable.
The example in figures
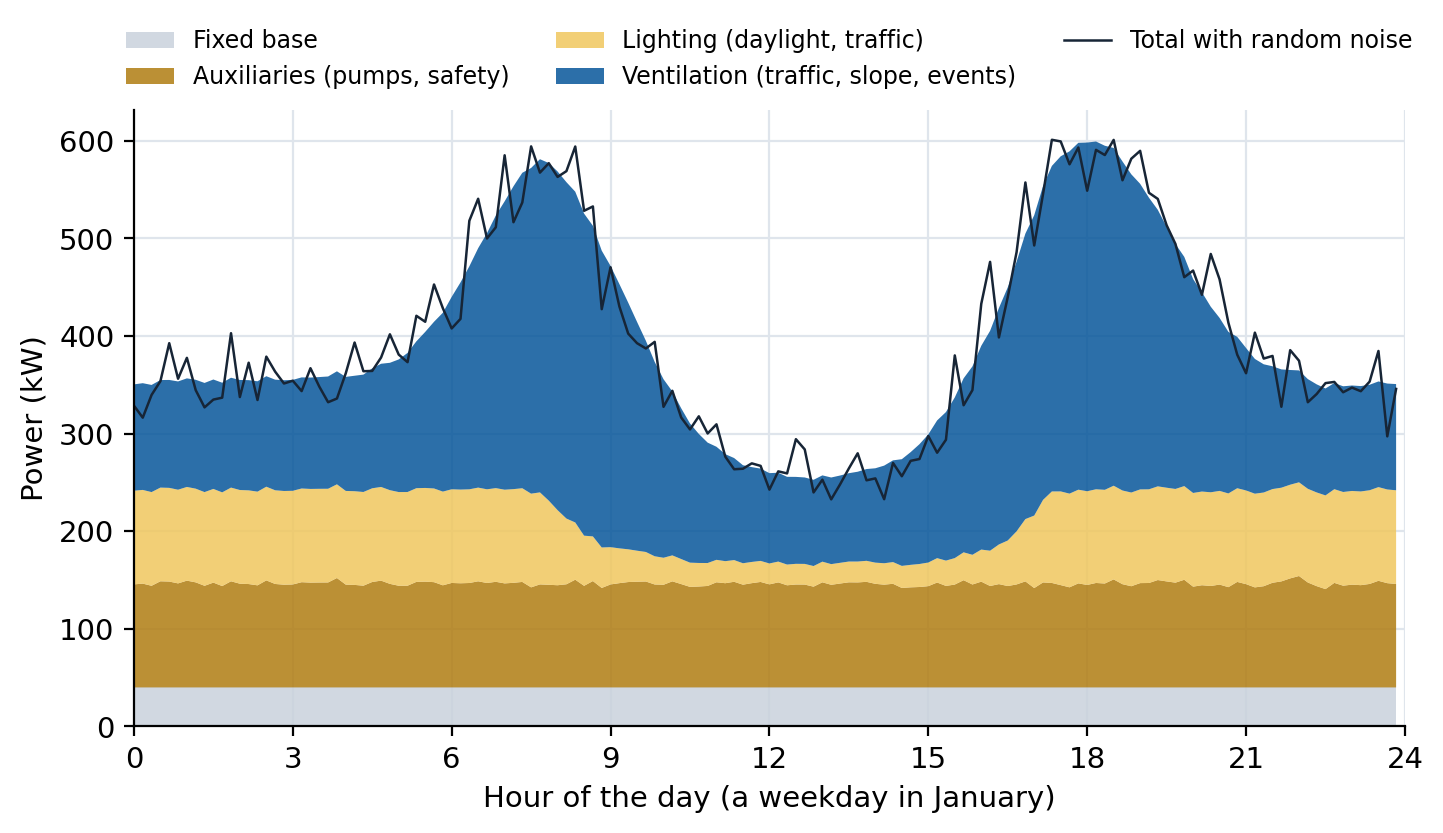
On a January weekday, ventilation carries the two traffic peaks; lighting rises at night and at the edges of the day.
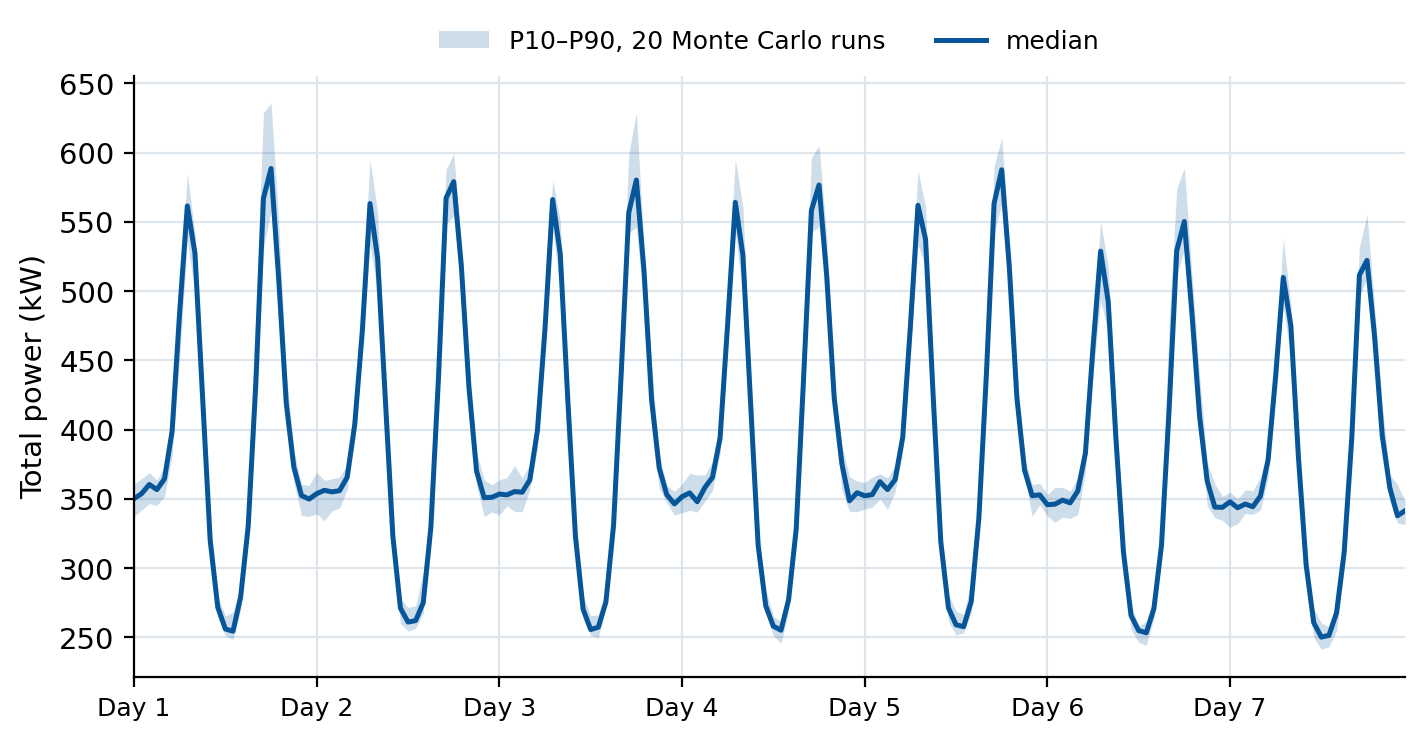
Over a year, the 1.5 km tunnel of the public example gives:
- a median of 3,233 MWh (P10 3,230, P90 3,237);
- a peak of 873 kW and a mean of 369 kW, i.e. a load factor of 0.42;
- 2,156 kWh per meter and per year.
What it brings, and its limits
- Brings: fast and transparent pre-design studies (lighting technology, ventilation type, traffic level); synthetic load profiles for research on energy management and renewables in tunnels; a clear teaching case for Monte Carlo uncertainty.
- Limits: the P10–P90 band is narrow because it only reflects the random events and noise of the model, not the uncertainty on its parameters. The coefficients are orders of magnitude, not measurements of a given tunnel. Calibrate against measured data before any engineering use or comparison with a real site.
Go further
- Full equations, runnable example and results: https://cyrilvoyant.github.io/tools/tunnel-load-simulator.html
- The web app: tunnel-load-simulator.onrender.com (free hosting: may take a minute to wake up)
- Article: H. El-Houari, C. Voyant, SoftwareX 35, 102946 (2026), doi:10.1016/j.softx.2026.102946
- Code: github.com/cyrilvoyant/tunnel-load-simulator · archive doi:10.5281/zenodo.20080042
- The simulator can also be driven in plain language through WebSemantic.
- The approach behind this work: Understand before you compute