Publications, logiciels, nominations et essais, dans l'ordre de leur parution sur ce site. Chaque billet s'ouvre sur place ; titres et résumés sont en français, le texte complet de la plupart des billets est en anglais. Les récits de recherche, classés par étape de la méthode, sont sur la page Récits. Flux Atom.
Nommé professeur invité à la faculté d'ingénierie de l'université de Kragujevac, avec mon collègue et ami Gilles Notton.
Lire le billet complet (en anglais)
Cyril Voyant
I am honoured to have been appointed Visiting Professor at the Faculty of Engineering, University of Kragujevac, together with my colleague and friend Prof. Gilles Notton.
This appointment formalises a long-standing and productive cooperation between Mines Paris-PSL, the University of Corsica, and the University of Kragujevac (Prof. Milan Despotovic). This collaboration has developed over several years through joint research, academic exchanges, Erasmus activities, and European project initiatives.
Scientific and practical interest
Our common wor focuses on renewable energy systems, solar irradiance forecasting, numerical modelling, data qualification, and AI-based methods designed for operational constraints. The collaboration is particularly valuable because it connects complementary expertise, different territorial contexts, and practical energy challenges across Europe.
Key message
Beyond the personal recognition, this appointment strengthens an active scientific and educational partnership between France, Corsica, and Serbia. It opens new perspectives for joint publications, student mobility, teaching activities, and future European projects in the field of energy transition.
Official announcement of Faculty of Engineering, University of Kragujevac
Titre original : Tunnel Load Simulator: an open-source generator for synthetic road-tunnel electricity demand
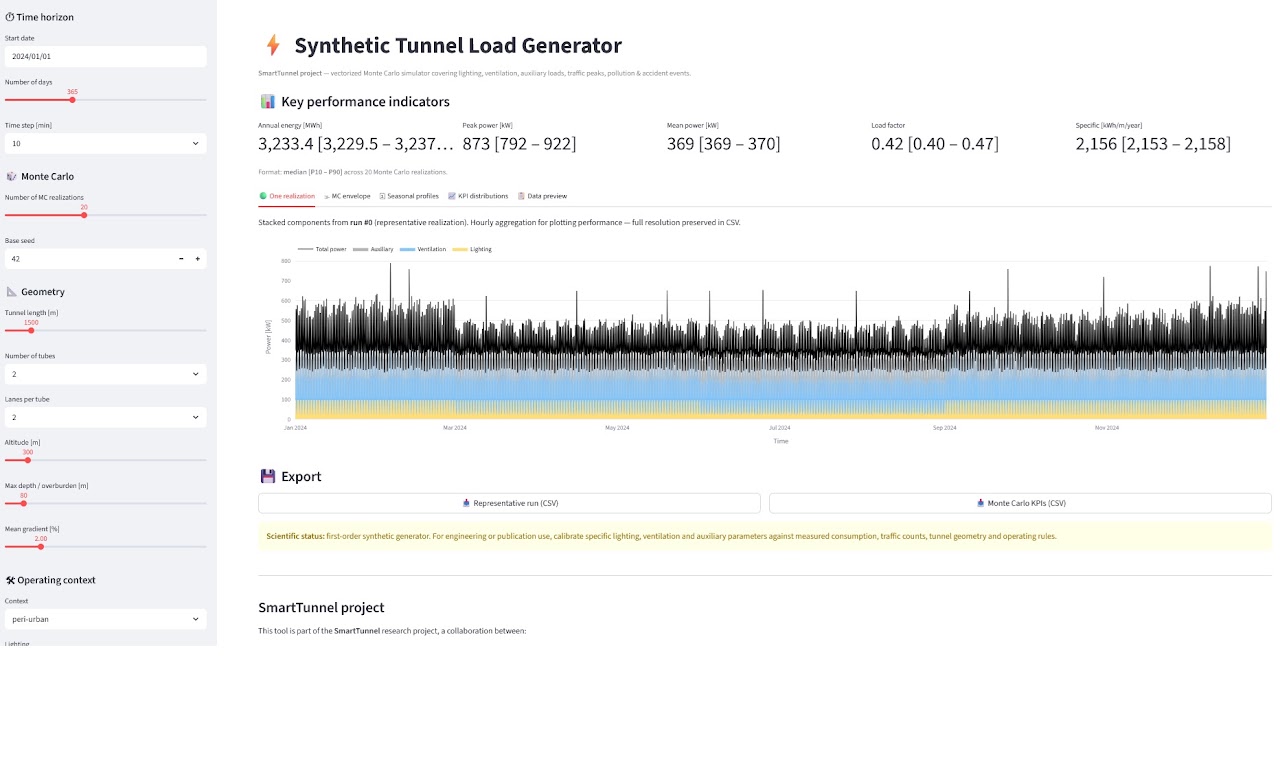
Application libre (Streamlit), développée dans le projet SmartTunnel, qui produit des profils de charge électrique synthétiques pour les tunnels routiers : éclairage, ventilation, auxiliaires, trafic, saisons et événements aléatoires.
Lire le billet complet (en anglais)
Haytham El-Houari and Cyril Voyant
The Tunnel Load Simulator is an open-source Streamlit application developed within the SmartTunnel project to generate synthetic electrical load profiles for road tunnels. It combines simplified representations of lighting, ventilation, auxiliary loads, traffic patterns, seasonal effects and stochastic events such as pollution episodes or accidents.
The tool produces high-resolution time series, typically at a 10-minute time step, and uses Monte Carlo simulations to represent uncertainty and operational variability.
The main strength of the simulator is its transparency: the assumptions, equations and code are openly available. It is also reproducible and citable, with a GitHub repository, MIT licence, citation metadata and Zenodo DOI.
The model separates the main physical and operational components of tunnel electricity demand, making the results easier to interpret than a purely black-box approach.
Scientific and practical interest
This tool is not intended to replace measured tunnel data or a calibrated engineering model. Its value is to provide a first-order synthetic generator for prototyping, sensitivity analysis, teaching and preliminary energy-system studies.
It can help explore how tunnel length, traffic, lighting, ventilation, slope, altitude and random events affect electricity demand. It also provides a useful basis for future work on calibration, forecasting, photovoltaic coupling and storage sizing.
Key message
The Tunnel Load Simulator is a transparent, open-source and citable research-software demonstrator for synthetic road-tunnel electricity demand. Its current role is to support early-stage modelling and discussion; with calibration on real tunnel data, it could become a stronger tool for tunnel energy analysis and management.
Le rayonnement diffus est l'une des composantes les plus difficiles de la ressource solaire, surtout là où aérosols, humidité et contrastes climatiques sont forts. Mesure et prévision de la fraction diffuse en Arabie saoudite, avec un modèle hybride par empilement.
Lire le billet complet (en anglais)
Measurement and forecasting of the diffuse fraction of solar irradiance using a hybrid stacking model in Saudi Arabia
Diffuse solar radiation remains one of the most complex components of the solar resource, particularly in regions affected by aerosols, humidity, and strong climatic contrasts.
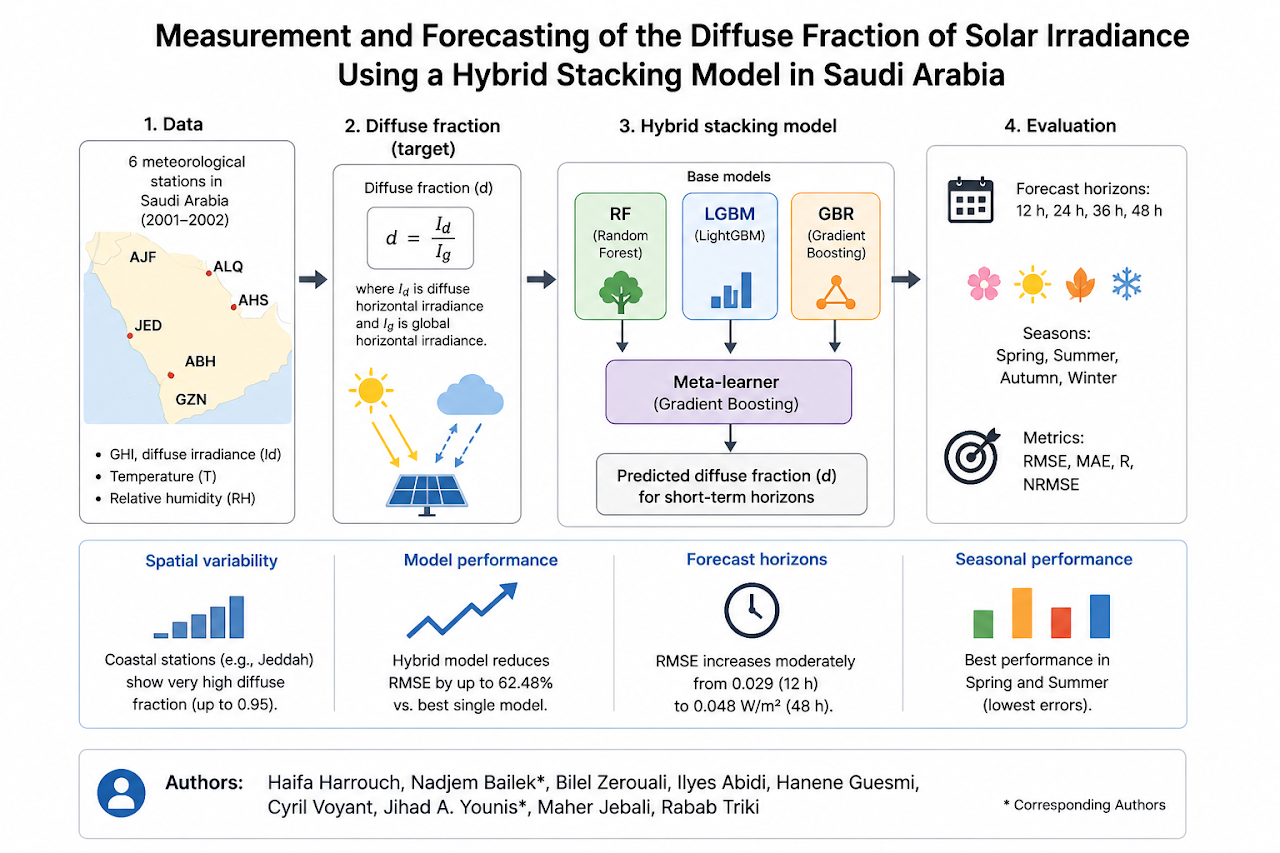
In this study, diffuse irradiance measurements collected across six representative stations in Saudi Arabia were combined with a hybrid stacking framework integrating Random Forest, Gradient Boosting, and LightGBM to analyze and forecast the diffuse fraction of solar irradiance.
The work simultaneously explores the physical variability of diffuse radiation and its short-term predictability under desert, coastal, and high-altitude atmospheric conditions.
Scientific impact: The analysis revealed strong spatial variability in diffuse solar regimes across Saudi Arabia. Coastal stations such as Jeddah reached diffuse fraction values close to 0.95, reflecting intense aerosol and humidity-driven scattering, while inland desert stations remained dominated by direct beam irradiance. The proposed stacking model significantly improved predictive skill compared with standalone learners, with forecast correlations between 0.94 and 0.97, and error reductions reaching 62.48% in some seasonal configurations. These results confirm that diffuse fraction dynamics are strongly climate-dependent and can be effectively learned through hybrid ensemble modeling.
Operational impact: Accurate prediction of diffuse fraction directly affects photovoltaic yield estimation, tilted irradiance transposition, bifacial PV modeling, and solar resource assessment in regions exposed to strong aerosol or humidity variability. The framework offers a practical tool for improving solar forecasting in operational environments where atmospheric conditions evolve rapidly.
Key message: Understanding how the atmosphere redistributes sunlight is not only a physical challenge; it is also a forecasting problem with direct implications for next generation photovoltaic systems .
La persistance revisitée pour les séries à statistiques périodiques, comme le cycle journalier du rayonnement solaire. BLEND combine la dernière observation et l'observation alignée sur la même phase du cycle.
Lire le billet complet (en anglais)
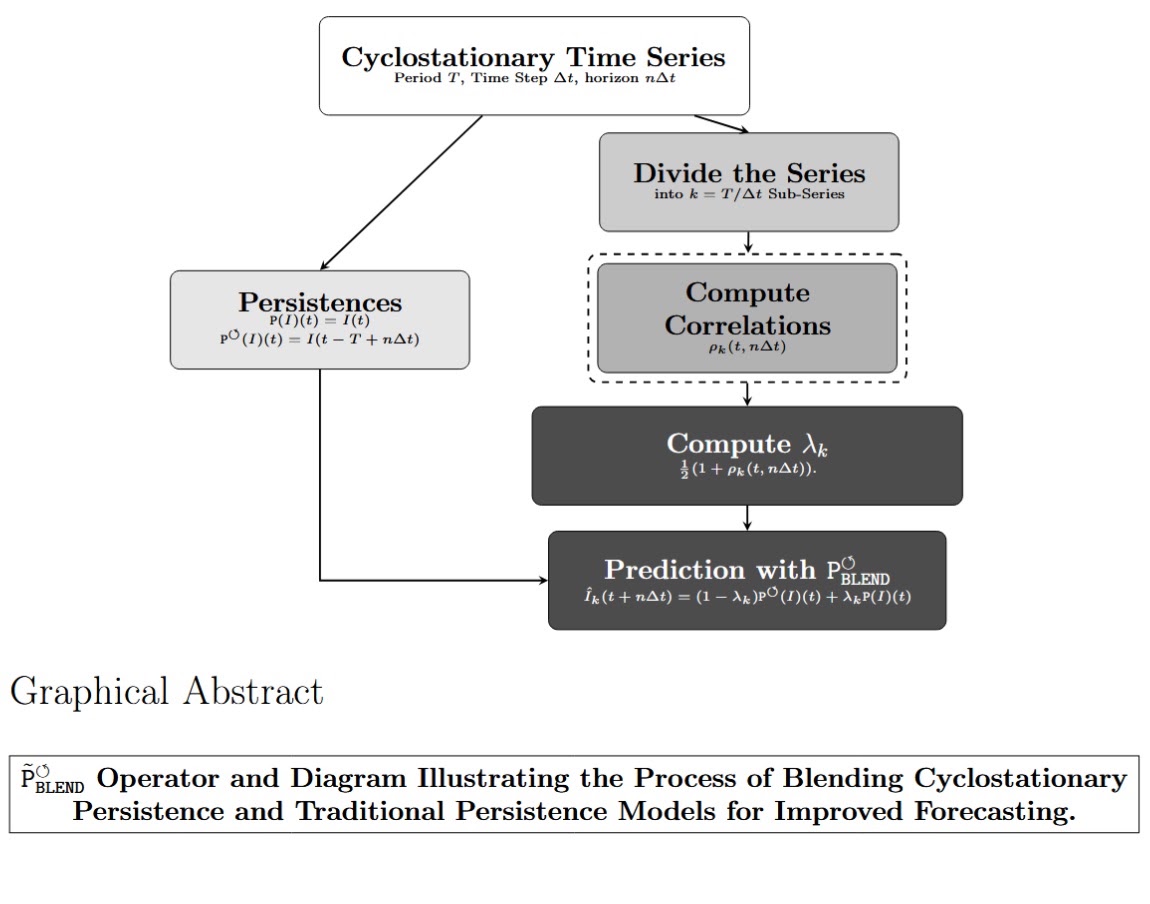
This work revisits persistence forecasting for periodically varying statistics, including the daily cycle of solar irradiance. BLEND combines the latest observation with an observation aligned to the target phase of the cycle.
The weights are estimated from historical observations in closed form. Phase-wise least squares provides an explicit baseline without iterative optimisation; a moments-based formulation is equivalent in population under its assumptions, but need not give exactly the same finite-sample estimate.
The paper evaluates these operators on controlled simulations and 68 SIAR stations. The separate open-code benchmark v1.1.1 uses held-out synthetic data and compares 21 references, including variants with and without a clear-sky model. It illustrates when phase information helps, without establishing a universal ranking.
Scientific contribution: a phase-aware analytical reference for comparing solar forecasts. The original raw-signal BLEND formulation does not require an external clear-sky model; the extended code also includes clear-sky-based variants, explicitly identified in the benchmark.
Practical use: inspect the assumptions, estimate parameters on past data, and evaluate on unseen observations. The synthetic code results and the measured-data results of the paper are separate experiments.
Les métriques classiques comme le RMSE jugent une prévision comme si chaque pixel devait coïncider parfaitement dans l'espace et le temps. L'indice γ accepte un décalage toléré, comme le fait un expert.
Lire le billet complet (en anglais)
Cyril Voyant
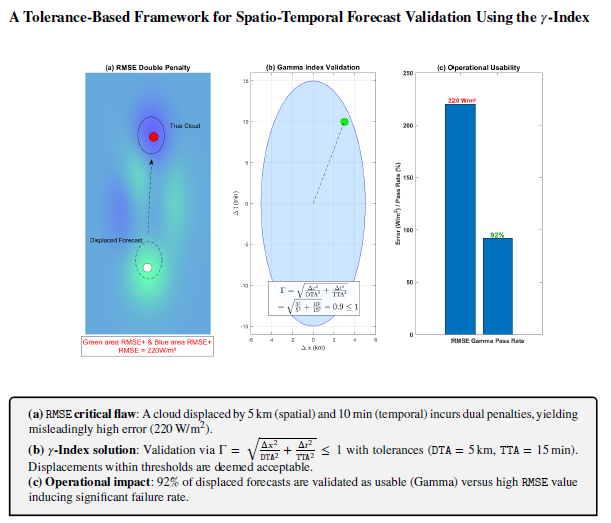
Classical metrics like RMSE evaluate forecasts as if every pixel must match perfectly in space and time. Machines optimize for that. Humans do not think that way.
This work introduces a tolerance-based framework using the γ-index, where forecasts are evaluated within physically meaningful margins (space, time, intensity). The originality lies in shifting from exact matching to acceptable agreement.
It bridges human operational reasoning and machine evaluation: a forecast slightly shifted but physically coherent is no longer “wrong” : it is usable
Results, impact, and perspectives :
The study demonstrates that classical pixel-wise metrics suffer from a structural limitation known as the double penalty: a small spatial or temporal shift leads to both a miss and a false alarm, artificially inflating the error. In controlled experiments, such shifts can produce large RMSE values (e.g., ~20–40 W/m²), even when the underlying physical structure is preserved.
The γ-index resolves this by embedding tolerances directly into the evaluation. Instead of penalizing displacement, it checks whether the forecast lies within an acceptable region in a joint space–time–intensity domain. The results are clear:
Mean γ remains stable (~0.29–0.35), showing robustness to small displacements
RMSE, in contrast, reacts strongly to minor misalignments and can misclassify usable forecasts as failures
This changes the interpretation of performance. The question is no longer “Is the forecast exact?” but “Is it operationally acceptable?” For the community, this has direct implications:
Meteorology: provides a unified and physically interpretable validation criterion
AI/ML: opens the door to tolerance-aware learning, where γ can be embedded as a constraint or loss term
The next step is important: moving from validation to learning. The γ-index is continuous and almost everywhere differentiable, making it compatible with optimization frameworks. This suggests a new paradigm where models are not trained to minimize pixel errors, but to respect physical tolerances.
In short, this parameter is more than a metric. It is a shift in how humans and machines agree on what “good” means
La production scientifique mondiale connaît une croissance sans précédent, amplifiée par l’essor des modèles d’intelligence artificielle générative. Dans ce contexte, la question n’est plus seulement de produire du savoir, mais d’en garantir la visibilité, la robustesse et la réutilisabilité.
Lire le billet complet
Cyril Voyant
La production scientifique mondiale connaît une croissance sans précédent, amplifiée par l’essor des modèles d’intelligence artificielle générative. Dans ce contexte, la question n’est plus seulement de produire du savoir, mais d’en garantir la visibilité, la robustesse et la réutilisabilité.
Cette page présente un cadre structurant de l’excellence scientifique fondé sur une approche systémique et multiplicative.
La dynamique actuelle se caractérise par :
une augmentation rapide du volume de publications
une hybridation croissante entre production humaine et assistée par IA
une dilution du signal scientifique dans un bruit informationnel massif
Un résultat rigoureux mais non accessible devient structurellement invisible.
Une approche systémique de l’excellence
L’excellence scientifique ne doit plus être considérée comme une propriété intrinsèque, mais comme un système reposant sur plusieurs dimensions interdépendantes.
Fondations
Rigueur (R)
Transparence (T)
Visibilité (V)
Adoptabilité (A)
Amplificateurs
Collaboration (C)
Ouverture (O)
Signification sociétale (S)
Formulation du cadre RTVACOS
E∝(R×T×V×A)×(1+C+O+S)
Cette formulation repose sur deux principes :
multiplicativité des fondations → si une dimension est nulle, l’impact global s’annule
effet amplificateur non compensatoire → les dimensions secondaires amplifient uniquement un socle solide
Du SEO au GEO : un changement de paradigme
La visibilité scientifique ne repose plus uniquement sur les citations humaines. Elle dépend désormais de la capacité des systèmes à :
identifier des entités (auteurs, méthodes, données)
exploiter des métadonnées structurées
relier contenus, code et jeux de données
Éléments clés :
identifiants persistants (ORCID, DOI)
métadonnées explicites
dépôts ouverts (code, données)
knowledge graphs
redondance contrôlée entre plateformes
Un contenu non structuré devient invisible pour les systèmes génératifs.
RTVACOS : un cadre réflexif, non normatif qui n’a pas vocation à produire un score.
Il permet : d’identifier les faiblesses structurelles d’un travail, d’éviter les effets de compensation artificielle, de guider les bonnes pratiques scientifiques. Toute instrumentalisation (optimisation superficielle, métriques vides) en annule la portée. Implications opérationnelles et pour les chercheurs :
maintenir une identité numérique cohérente
publier code et données
structurer les métadonnées
documenter les processus (y compris échecs)
Pour les institutions :
dépasser les indicateurs volumétriques
valoriser reproductibilité et réutilisabilité
investir dans les compétences data/metadata
Conclusion : La rigueur reste nécessaire mais insuffisante. L’excellence scientifique devient une question d’ingénierie de la connaissance : structurer, relier et diffuser les savoirs pour assurer leur existence effective dans un écosystème algorithmique.
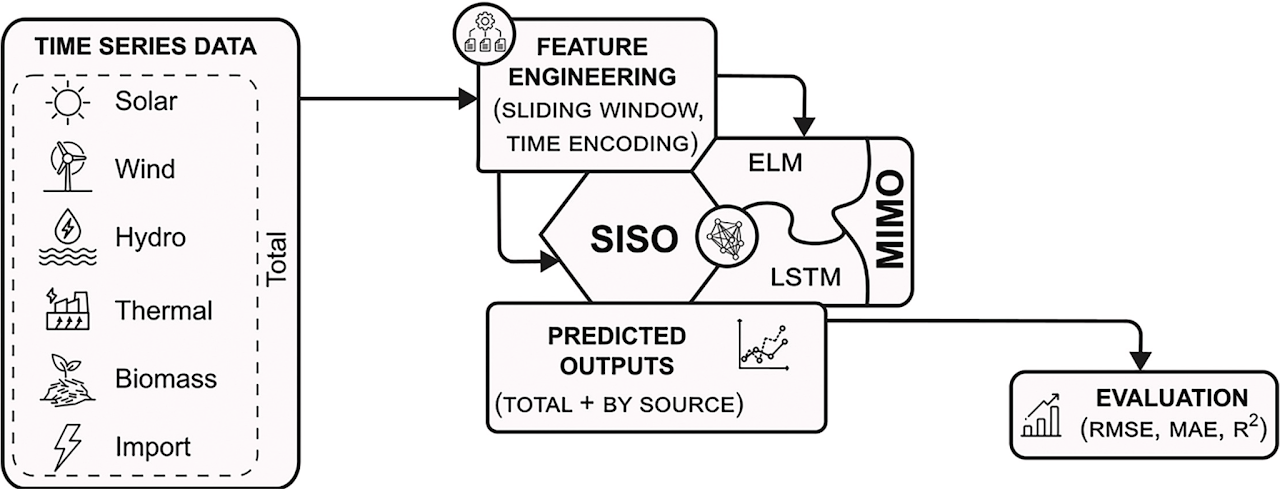
Une prévision à court terme rapide, transparente et opérationnelle de la demande et de la production de plusieurs sources d'énergie.
Lire le billet complet (en anglais)
Fast, transparent, and operational short-term forecasting of demand and generation across multiple energy sources.
Modern power systems are becoming structurally more complex. Renewable integration, self-consumption, distributed resources, and partial interconnections introduce strong variability and cross-dependencies between energy sources. In this context, forecasting is no longer about predicting a single time series. It is about predicting a system. A new study published in Applied Energy presents a unified Multi-Input Multi-Output Extreme Learning Machine (MIMO-ELM) framework designed for short-term forecasting of multi-source energy systems. The model simultaneously predicts seven grid variables: total demand and generation from solar PV, wind, hydropower, thermal power, bioenergy, and imports.
What the study shows
Using six years of hourly data from Corsica, the MIMO-ELM framework jointly forecasts seven variables: total demand and generation from solar PV, wind, hydropower, thermal power, bioenergy and imports.
At a one-hour horizon, the published study reports nRMSE values of 0.179 for solar generation and 0.051 for thermal generation, with R² above 0.98 for both series. Total-demand forecasts remain reliable up to five hours ahead within this study. Comparisons with persistence and LSTM must be read with the reported data split, tuning budget and computational constraints.
The multi-output formulation represents several responses in one model. It does not, by itself, impose an exact energy balance. Physical conservation requires an explicit constraint or reconciliation step.
La recherche est passée de la rareté à la saturation : produire du savoir n'est plus le goulot d'étranglement ; être trouvé, jugé crédible et réutilisé, si.
Lire le billet complet (en anglais)
Cyril Voyant
The research landscape has shifted from scarcity to saturation: producing knowledge is no longer the bottleneck: being discovered, trusted, and reused is.
In an AI-accelerated environment, impact follows attention dynamics and depends on visibility, transparency, and operational adoption rather than venue prestige alone. Work that cannot be found or verified remains effectively nonexistent. Discoverability, metadata quality, reproducibility, and clear failure modes have become integral parts of the scientific method. Rigor builds credibility, transparency builds trust, and usability enables adoption. Visibility is not vanity; it is the infrastructure that allows knowledge to circulate and survive algorithmic filtering. Outreach and collaboration amplify impact only when foundations are solid. In this context, publishing is necessary but insufficient: impact must be engineered. Research that remains invisible delays innovation and contributes little to practice. The objective is no longer to publish more, but to ensure that robust knowledge is discoverable, credible, and usable.
Titre original : Appointed Associate Editor for Scientific Reports (Nature Portfolio)
Une revue pluridisciplinaire qui couvre tous les domaines scientifiques ; ce rôle prolonge mon parcours de directeur de recherche à Mines Paris – PSL (centre O.I.E.).
Lire le billet complet (en anglais)
Cyril Voyant
Appointed Associate Editor for Scientific Reports (Nature Portfolio), a multidisciplinary peer-reviewed journal with strong impact.
Handling submissions in my areas of expertise:
Renewable energy: Solar irradiance forecasting (GHI), ML applied to PV/hybridation, microgrids
Medical physics: Radiotherapy , radiobiology, equivalent dosimetry
This role aligns with my trajectory as Research Director at Mines Paris–PSL O.I.E. (since 2024), with >130 peer-reviewed publications (h-index ~35, >7000 citations, Stanford Top 2%). Scientific Reports covers all scientific domains.
The editorial team comprises >2000 global experts (https://www.nature.com/srep/about/editors). My appointment highlights French interdisciplinary research in energy/ML/medicine. .
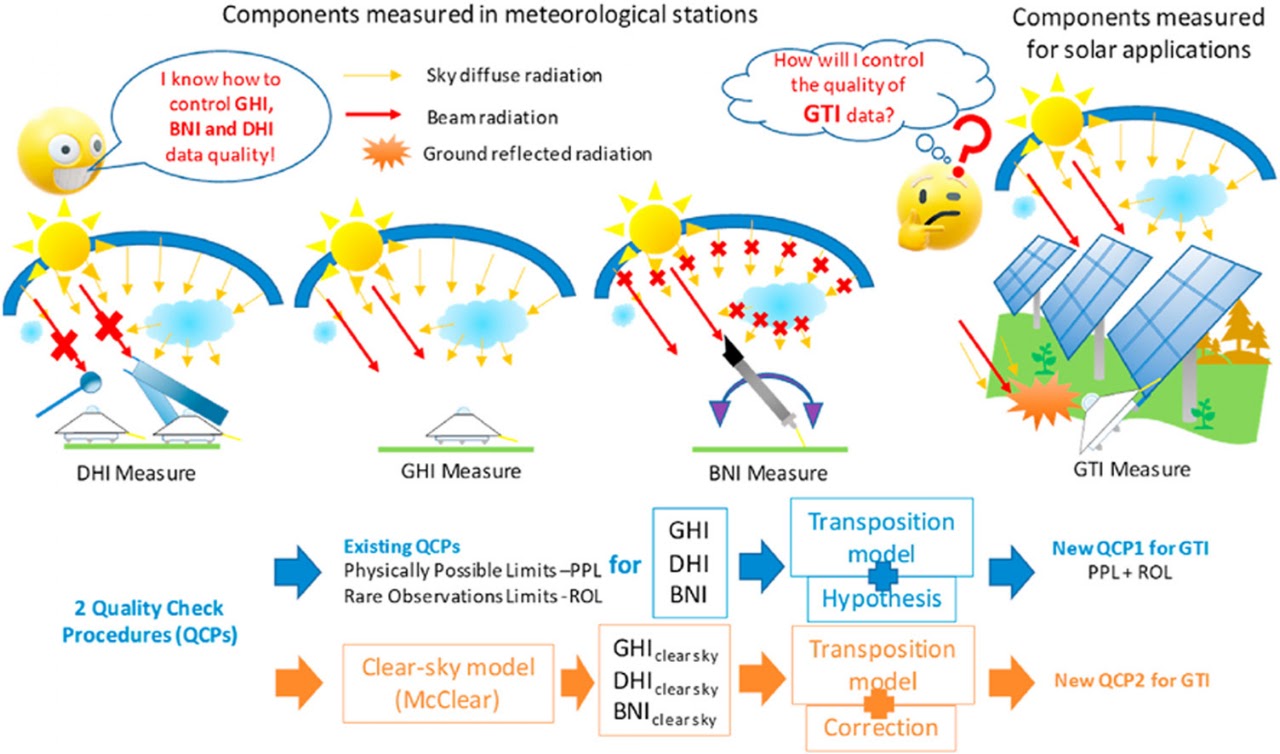
Un cadre de contrôle qualité pour le rayonnement mesuré sur plan incliné, issu de la thèse de Mohammed Asloune (université de Corse et Mines Paris – PSL).
This work is part of the doctoral research of Mohammed Asloun (University of Corsica & Mines-PSL).
Objectives
This paper introduces a generic and systematic quality control (QC) framework dedicated to tilted solar irradiance time series, a well-known but insufficiently standardized issue in photovoltaic (PV) forecasting and operations. The primary objective is to provide a robust, transferable methodology for detecting and correcting outliers, inconsistencies, and sensor-related anomalies in tilted irradiance measurements. The proposed framework is designed to be site-independent, instrumentation-agnostic, and directly applicable in operational and industrial contexts, with the ambition of serving as a reference standard for PV modelling, forecasting, and performance assessment.
Key results
The proposed QC framework significantly improves the reliability and consistency of tilted irradiance datasets, leading to measurable gains in PV forecasting accuracy, operational robustness, and data bankability, thereby establishing it as a strong candidate for a standard preprocessing step in PV energy systems.
Titre original : Towards Personalized Radio-Iodine Therapy: Modeling, Dynamics, and Clinical Perspectives
Marie Fusella Giuntini (doctoral work), Cyril Voyant, David Taieb, Dominique Barbolosi
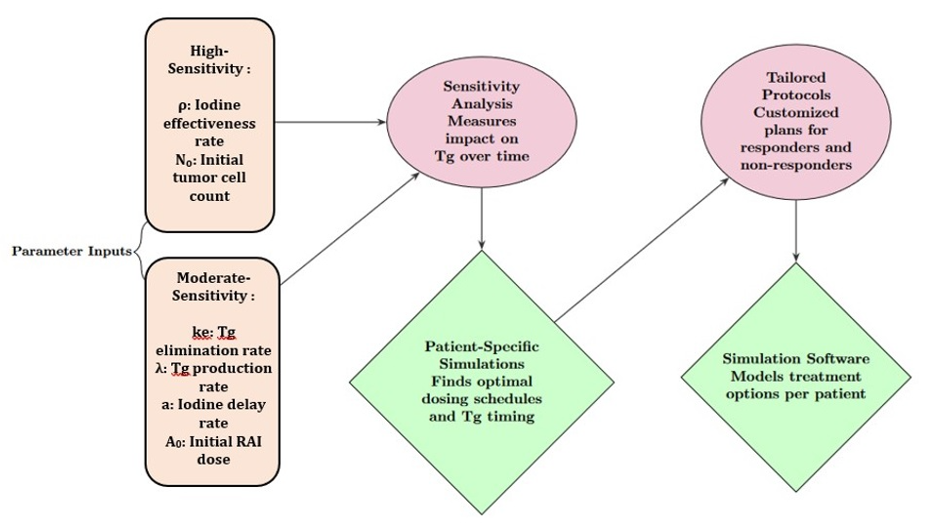
Une contribution doctorale de Marie Fusella Giuntini, avec les universités d'Aix-Marseille et de Corse, Mines Paris – PSL et l'hôpital de la Timone : deux articles, un modèle mécaniste et une revue des approches de modélisation.
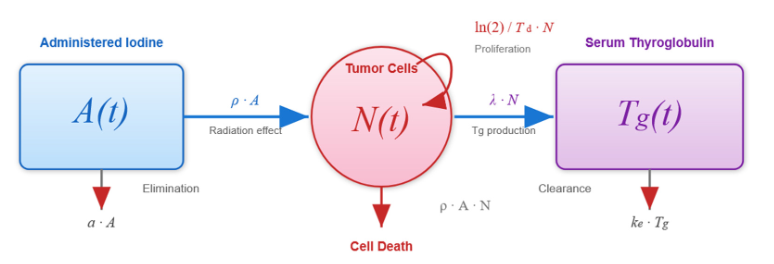
A doctoral contribution by Marie Fusella Giuntini, in collaboration with Aix-Marseille, Corsica Universities, Mines-PSL, and la Timone Hospital : Marie Fusella Giuntini, Cyril Voyant, David Taieb and Dominique Barbolosi.
A coherent research line at the interface of modeling and nuclear medicine, two papers proposed with:
- The common objective is to improve the understanding and personalization of radio-iodine therapy (RAI) in metastatic thyroid cancer by combining mechanistic modeling, computational tools, and clinical insight.
- RAI remains essential for differentiated thyroid cancer management, yet response variability across patients is considerable. Personalization requires quantitative frameworks capable of linking uptake, kinetics, and biological response. This study contributes to this emerging field through two complementary publications that structure the methodological and conceptual foundations of patient-specific RAI modeling.
This article introduces a mechanistic ODE-based model describing individual tumor kinetics under RAI exposure. The model captures uptake, effective clearance, and response dynamics, and is coupled with a surrogate layer allowing rapid simulation of treatment scenarios. The contribution lies in providing a patient-specific predictive tool that can support dose optimisation and explore therapeutic trajectories without relying on overly burdensome protocols. It represents a concrete step toward operational personalization.
The second publication offers a state-of-the-art review of computational approaches for RAI therapy: dosimetric formalisms, PK/PD models, mechanistic methods, AI-based predictions, and hybrid frameworks. It situates current challenges: data scarcity, inter-individual variability, lack of prospective validation; while highlighting the growing role of modeling in moving from empirical dosing toward adaptive, model-informed treatment strategies.
Together, these two papers articulate a clear research trajectory:
-a methodological contribution that demonstrates how individualized dynamics can be formally modeled;
-a conceptual synthesis showing how this work aligns with, and advances, international efforts in computational nuclear medicine
Titre original : Grateful to be included in the 2025 Stanford-Elsevier Top 2% Scientists ranking.
Une reconnaissance pour les travaux menés à Mines Paris – PSL en prévision solaire, systèmes photovoltaïques, IA pour l'énergie et physique médicale.
Lire le billet complet (en anglais)
Proud to contribute to research in solar forecasting, PV systems, AI for energy, and medical physics at Mines Paris – PSL.
Thanks to all collaborators and students for their essential role.
The Stanford-Elsevier Top 2% Scientists list identifies the world’s most cited researchers based on a standardized composite of Scopus bibliometric indicators, including total citations, h-index, co-authorship-adjusted metrics, and field-normalized impact.
The Stanford-Elsevier Top 2% Scientists list identifies the world's most cited researchers using a standardized composite indicator based on Scopus bibliometric data, including total citations, h-index, co-authorship-adjusted indices, and field-normalized impact metrics. It provides both career-long and single-year rankings across all scientific disciplines.
I am honored to be included in the 2025 edition of this ranking, and particularly proud to contribute to the strong performance of Mines Paris – PSL, which ranks among the leading institutions worldwide, with approximately 10% of its faculty members recognized in the Top 2% cohort.
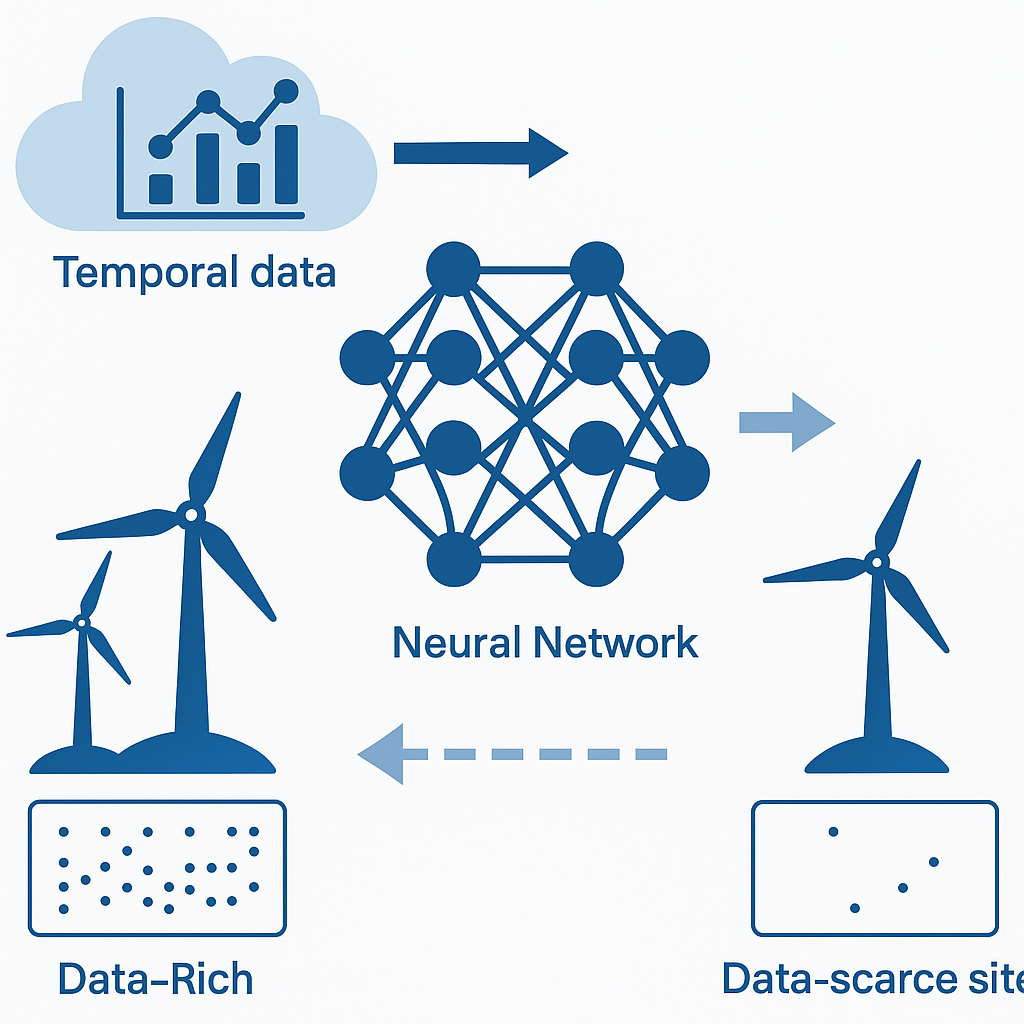
Réutiliser des modèles entraînés sur des sites riches en données permet de prévoir la vitesse du vent sur des sites qui en ont peu : sur 4 830 expériences, une précision comparable à l'apprentissage direct (écart de nRMSE inférieur à 0,01).
Published in: International Journal of Green Energy (2025)
This paper demonstrates that transfer learning can accurately forecast wind speed in data-scarce regions by reusing models trained on data-rich sites. Across 4,830 experiments, TL achieved accuracy comparable to direct learning (ΔnRMSE < 0.01). The approach offers a scalable, low-data solution for expanding wind forecasting to under-instrumented areas.
Why This Matters
Wind energy forecasting is essential for grid stability, but many regions lack long-term, high-quality wind data.
Conventional machine-learning models require extensive local measurements, making them impractical for data-scarce environments.
This study explores transfer learning (TL) as a way to overcome that limitation, reusing models trained in data-rich locations to forecast wind speed in poorly instrumented areas.
Key Results
Dataset: 70 meteorological stations across Spain, covering various climatic zones.
Methods compared: Transfer Learning (TL), Direct Learning (DL) and Two model families: Extreme Learning Machine (ELM) and Autoregressive (AR).
Forecast horizons: 30 min → 6 h (360 min).
Metrics: normalized RMSE (nRMSE) and normalized MAE (nMAE).
Findings: TL performance nearly matches DL: nRMSE ≈ 0.297 (TL) vs 0.292 (DL) at 30 min horizon, nRMSE ≈ 0.674 (TL) vs 0.640 (DL) at 6 h horizon
Over 4,830 TL experiments confirm robust generalization even with sparse local data.
Conclusion: TL retains most of the predictive skill while drastically reducing data requirements.
Practical Applications
Wind farm operators: deploy accurate short-term forecasts at new or under-instrumented sites without waiting for years of data collection.
Researchers: framework for domain adaptation of ELM/AR models across heterogeneous climates.
Energy planners: supports rapid expansion of renewable infrastructure in developing or remote regions.s.
The Impact
This work demonstrates that transfer learning is not only feasible but scalable for renewable energy forecasting.
It bridges the gap between data-rich and data-poor regions, enabling fairer access to AI-driven forecasting tools.
The approach can generalize to other energy domains (solar, hydro) where local data scarcity hinders modeling, marking a key step toward universal, transferable forecasting intelligence.
La fouille de textes de 500 articles cartographie la recherche mondiale en prévision solaire : forte montée de l'IA et de l'apprentissage profond, portée par la Chine, les États-Unis et l'Inde, et métriques déterministes encore dominantes.
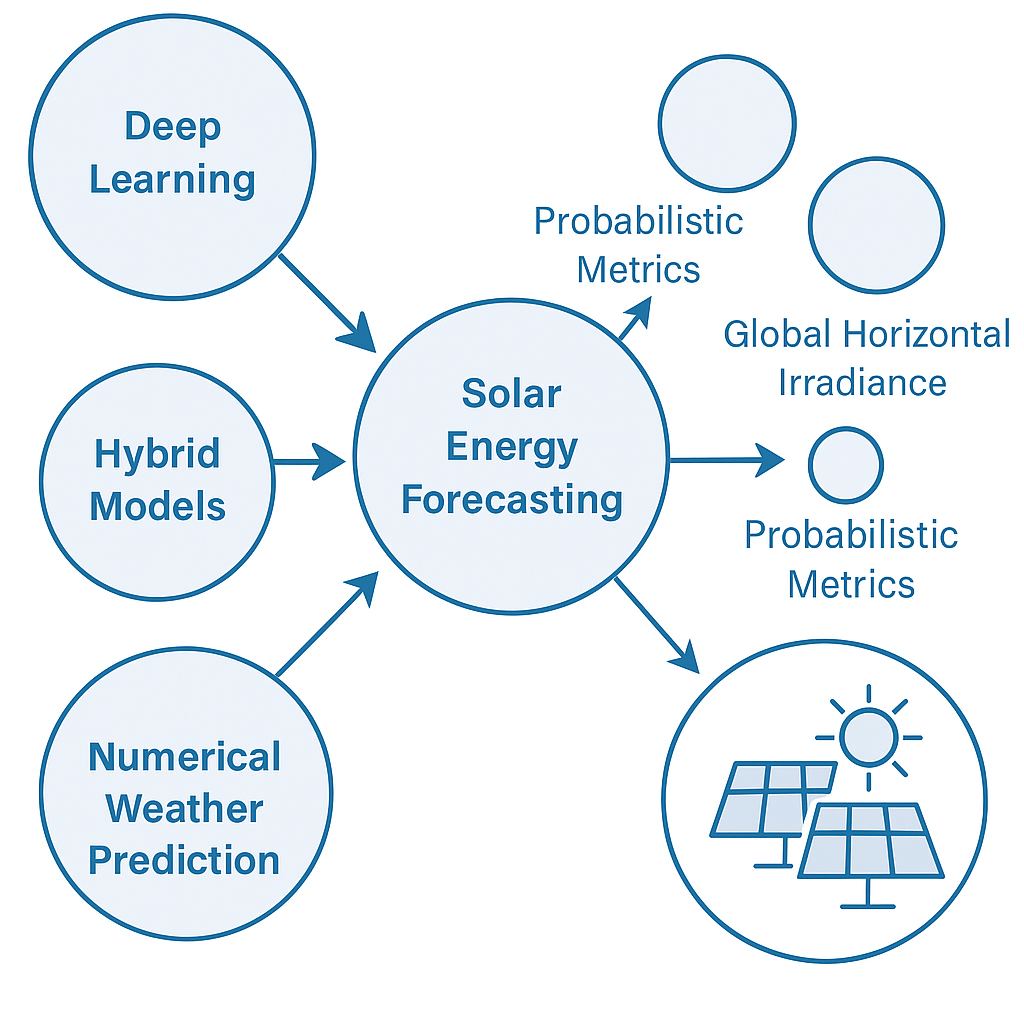
The study applies text mining to 500 papers (2017–2023) to map global trends in solar energy forecasting. It reveals a strong rise of AI and deep learning, led by China, the USA, and India, and shows that deterministic metrics still dominate probabilistic ones. The work delivers a reproducible overview and standardized terminology, advancing transparency and collaboration in solar forecasting research .
Why This Matters
Accurate solar energy forecasting is central to grid stability and renewable energy integration.
Since 2017, the field has undergone a paradigm shift deep learning, hybrid physical, statistical models, and large, scale datasets have reshaped methodologies.
This paper provides the first comprehensive text-mining update of global solar forecasting research since 2017, clarifying who leads the field, which methods dominate, and how terminology has evolved.
It creates a reproducible and quantitative reference map for the community.
Key Results
Corpus: 500 peer-reviewed papers (2017–2023), including 276 full-texts processed via Elsevier’s API using text-mining tools (R, rvest, Jaccard clustering).
Geographic leadership: 🇨🇳 China now dominates (343 affiliations), followed by 🇺🇸 USA (131) and 🇮🇳 India (107). This marks a major shift from 2012–2017, when the USA led.
Top journals: Energy Reports, IEEE Access, Solar Energy, Renewable Energy, IEEE Transactions on Sustainable Energy. → Strong rise of open-access venues after 2017.
Leading authors: Fei Wang, Zhao Zhen, Martin János Mayer, and Dazhi Yang (one of the few bridging both study periods).
Thematic evolution: Explosion of AI-related acronyms (LSTM, CNN, RNN, ELM, GAN). Deterministic error metrics mentioned ≈ 11× more often than probabilistic ones. Global Horizontal Irradiance (GHI) remains the dominant forecasted variable, though often insufficient for operational PV control where GTI/POA are more relevant.
Data sources: Numerical Weather Prediction (ECMWF-EPS, WRF), satellite constellations (MSG, GOES, JMA/Himawari), and ground networks (BSRN, SURFRAD).
Methodological focus: combination of metadata and full-text mining to detect structural trends, institutional networks, and terminology convergence.
Practical Applications
For researchers:
Provides a unified, machine-readable taxonomy of abbreviations and metrics.
Highlights methodological shifts toward deep and hybrid learning, guiding future model benchmarking.
For energy operators and industry:
Identifies the main academic and industrial players in solar forecasting (e.g., NREL, North China Electric Power Univ.).
Helps select relevant modeling strategies by quantifying the prevalence of approaches and data sources.
For policymakers:
Offers quantitative evidence of global research dynamics, useful for prioritizing collaborations and funding strategies.
The Impact
This work transforms fragmented literature into a structured knowledge map of the solar forecasting domain.
It confirms the global pivot from physics-driven to AI-driven forecasting, the emergence of China as a scientific leader, and the persistent under-representation of probabilistic frameworks.
By ensuring reproducibility, transparency, and terminological coherence, the study sets a methodological benchmark for future meta-analyses of renewable forecasting research.
Des modèles linéaires prédisent l'erreur de prévision du rayonnement à partir de la variabilité locale, mesurée par l'écart-type des variations horaires de l'indice de ciel clair.
Lire le billet complet (en anglais)
Published in: Solar Energy (2025)
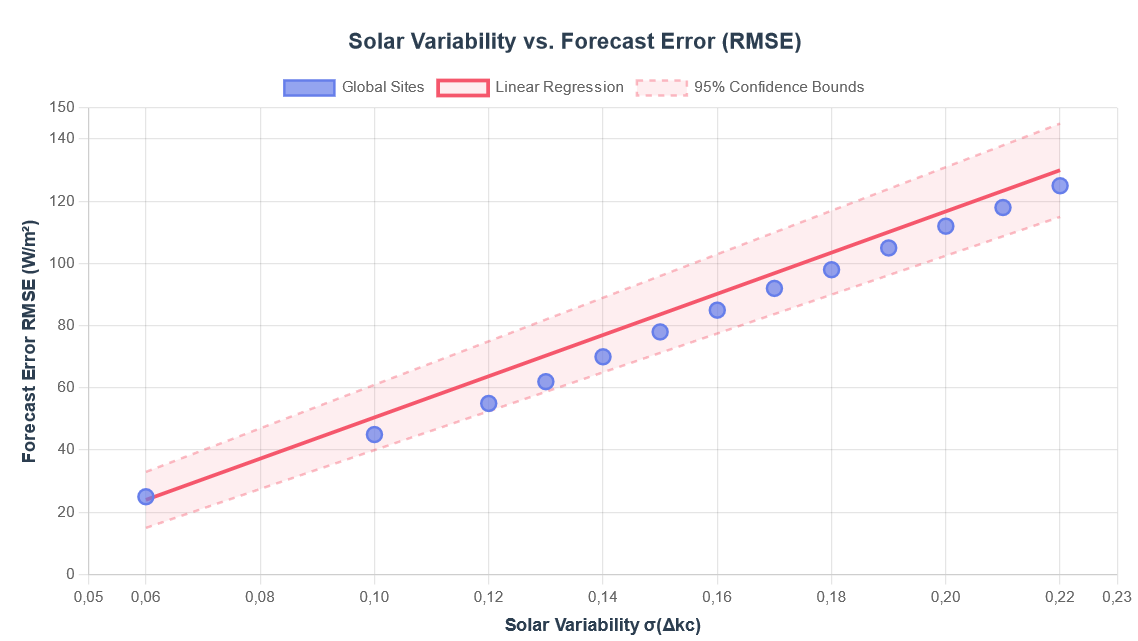
Researchers have developed linear models that predict solar irradiance forecast errors using only solar variability at a specific location. This variability is measured by the standard deviation of hourly changes in the clear sky index, essentially capturing how much solar conditions fluctuate hour to hour.
Why This Matters
Traditional solar forecasting requires complex numerical weather models, machine learning algorithms, and significant computational resources. This new approach needs only one year of solar data and basic calculations to assess forecast difficulty at any location worldwide.
Key Results
The models show strong correlations between solar variability and forecast errors:
Validation across 60 global sites and comparison with published results from SURFRAD network stations confirm the models' accuracy.
Practical Applications
Solar Developers: Quick site assessment for forecast difficulty before investing in forecasting infrastructure or solar farms.
Grid Operators: Better understanding of solar variability impacts and verification of existing forecasting systems.
Researchers: Standardized benchmarking tool for new forecasting methodologies.
The Impact
This approach enables faster project development, more accurate financial modeling, and better grid integration planning. By making forecast difficulty assessment accessible without extensive forecasting expertise, it particularly benefits smaller developers and emerging markets.
The methodology works globally using satellite data, making it valuable for solar development in regions with limited ground measurement infrastructure.
Titre original : New Release: LQL-Equiv: Open‑Source Software for Biologically Equivalent Dose Calculation in Radiotherapy
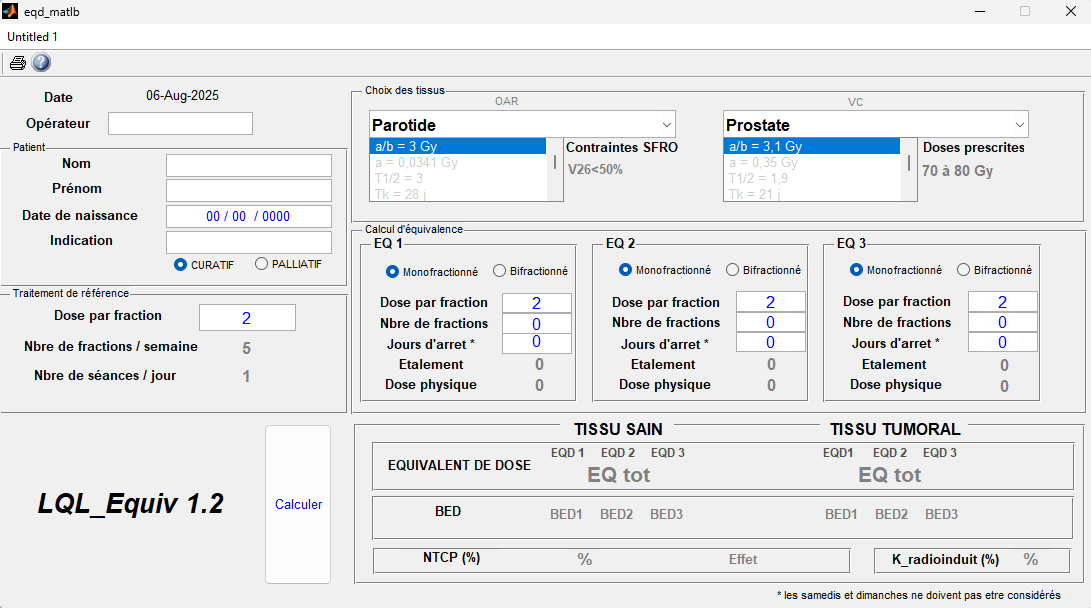
Logiciel libre écrit en MATLAB par Cyril Voyant et Daniel Julian : calcul voxel par voxel de l'EQD₂ et de la BED avec le modèle linéaire-quadratique-linéaire.
LQL‑Equiv is a free & open‑source software (GNU‑based) written in MATLAB and distributed as a standalone executable, developed by Cyril Voyant & Daniel Julian. It computes voxel‑wise Equivalent Dose in 2 Gy fractions (EQD₂) and Biologically Effective Dose (BED) using a Linear‑Quadratic‑Linear (LQL) model that explicitly accounts for fraction size, overall treatment time, and cellular repopulation effects, outperforming standard LQ-based calculators.
Theoretical Basis: Integrates the Astrahan LQL framework for high‑dose per fraction regimens (> dₜ), Dale’s repopulation corrections, and Thames’s multi‑fractionation modeling, implemented in an algorithm that minimizes a custom cost function to compute accurate EQD₂ and BED across complex radiotherapy scenarios.
Clinical Relevance: Validation studies report dose discrepancies up to ~25 % when compared to conventional LQ-based models, particularly relevant in hypo‑ and hyper‑fractionated protocols and in presence of treatment interruptions, a difference largely driven by tumor repopulation dynamics in prostate cancer cases.
Interface & Deployment: LQL‑Equiv is distributed as a Matlab® standalone GUI application, requiring MATLAB Runtime on Windows (no full MATLAB license needed). The interface offers few but essential adjustable parameters (e.g. α/β ratio, kick-off time Tₖ, potential doubling time Tₚₒₜ), ensuring usability and focus on reproducibility.
Regulatory Scope: LQL‑Equiv is intended for research use and secondary validation only, not as a clinically certified tool. Users must verify outputs and remain responsible for clinical interpretation; the developers disclaim liability for misuse.
As a Resume:
Validated performance: deviations typically < 25 % compared to standard computations.
Fully open‑source available with GUI and adjustable biological parameters.
Already cited in Google Scholar, documented on ResearchGate, and archived on Zenodo.
Designed for medical physicists and clinical researchers in radiotherapy to support accurate and personalized treatment evaluation.
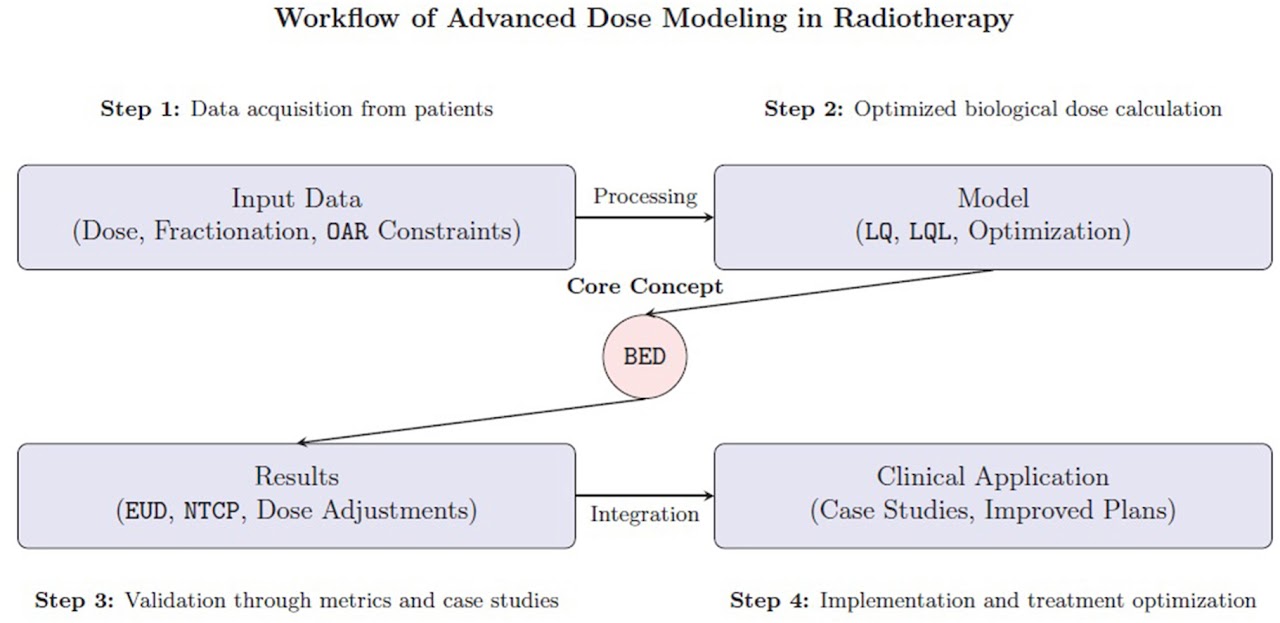
Titre original : Improving Clinical Decision-Making in Radiotherapy: A Comparative Analysis of Linear-Quadratic LQ and Linear-Quadratic-Linear LQL Dose Models
C. Voyant, D. Julian, S. Muraro, V. Bodez, M. Pinpin, D. Leschi, R. Oozeer, G. Wided, M.-A. Acquaviva, S. Prapant, O. Gahbiche, N. Bouaouina
Un article collectif qui compare les modèles linéaire-quadratique (LQ) et linéaire-quadratique-linéaire (LQL) ; méthodes, résultats et limites cliniques dans l'article publié.
This collaborative paper compares the linear-quadratic (LQ) and linear-quadratic-linear (LQL) dose models in radiotherapy. Read the published article for the methods, results and clinical limitations.
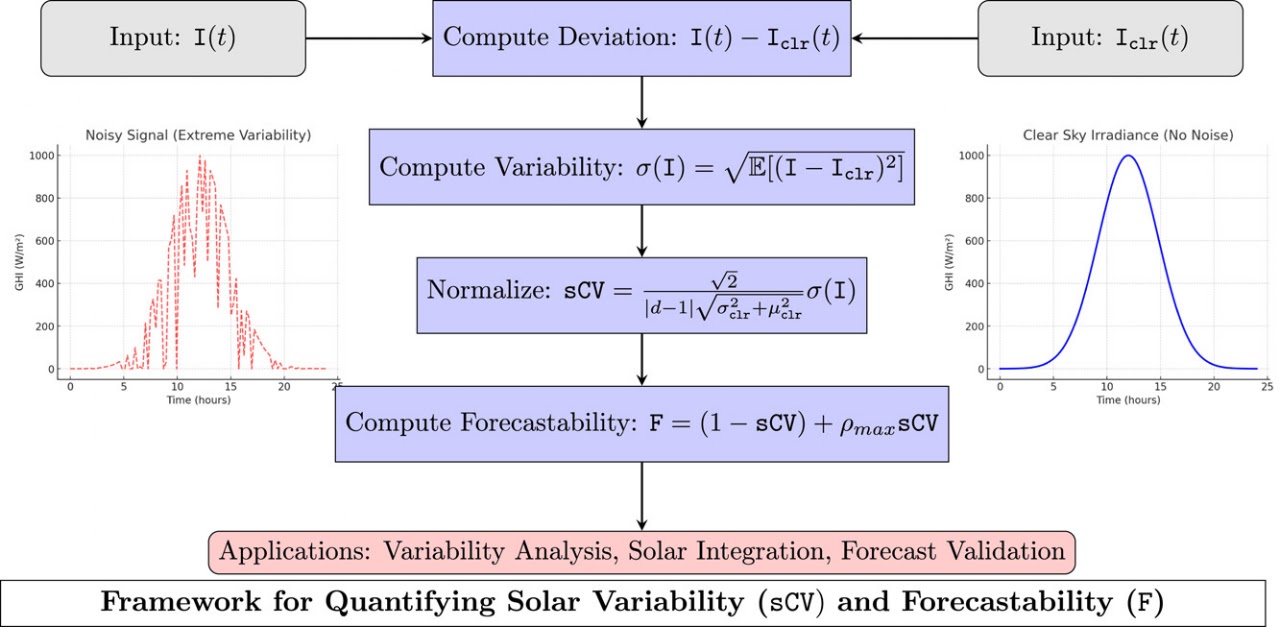
Le sCV et la prévisibilité F séparent les fluctuations aléatoires des tendances déterministes que l'écart-type mélange, pour caractériser un site avant de comparer des modèles.
This work presents a robust framework for quantifying solar irradiance variability and forecastability through the Stochastic Coefficient of Variation (sCV) and the Forecastability (F). Traditional metrics, such as the standard deviation, fail to isolate stochastic fluctuations from deterministic trends in solar irradiance. By considering clear-sky irradiance as a dynamic upper bound of measurement, sCV provides a normalized, dimensionless measure of variability that theoretically ranges from 0 to 1. F extends sCV by integrating temporal dependencies via maximum autocorrelation, thus linking sCV with F. The proposed methodology is validated using synthetic cyclostationary time series and experimental data from 68 meteorological stations (in Spain). Our comparative analyses demonstrate that sCV and F proficiently encapsulate multi-scale fluctuations, while addressing significant limitations inherent in traditional metrics. This comprehensive framework enables a refined quantification of solar forecast uncertainty, supporting improved decision-making in flexibility procurement and operational strategies. By assessing variability and forecastability across multiple time scales, it enhances real-time monitoring capabilities and informs adaptive energy management approaches, such as dynamic outage management and risk-adjusted capacity allocation
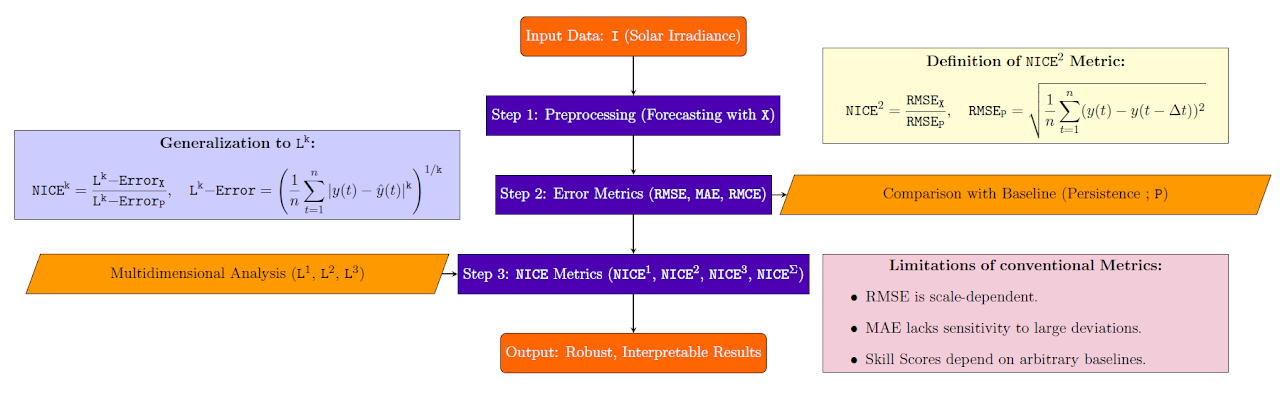
Le RMSE, le MAE et les scores de compétence ne saisissent pas toute la qualité d'une prévision solaire. Les métriques NICEᵏ rapportent les erreurs à celles d'une référence explicite, la persistance.
Lire le billet complet (en anglais)
Sustainable Energy Technologies and Assessments, 2025, https://doi.org/10.1016/j.seta.2025.104588
Abstract
Accurate solar energy output prediction is fundamental to integrating renewable energy sources into electrical grids, maintaining system stability, and enabling effective energy management. However, conventional error metrics, such as Root Mean Squared Error (RMSE), Mean Absolute Error (MAE), and Skill Scores (SS)—fail to capture the multidimensional complexity of solar irradiance forecasting. These metrics lack sensitivity to forecastability, rely on arbitrary baselines (e.g., clear-sky models), and are poorly adapted to operational needs.
To address these limitations, this study introduces the NICE^k metrics (Normalized Informed Comparison of Errors, with k = 1, 2, 3, Σ), a novel evaluation framework offering a robust, interpretable, and multidimensional assessment of forecasting models. Each NICE^k score corresponds to a specific L^k norm: NICE^1 emphasizes average errors, NICE^2 highlights large deviations, NICE^3 focuses on outliers, and NICE^Σ combines all three dimensions.
The methodology combines synthetic Monte Carlo simulations with real-world data from the Spanish SIAR network, encompassing 68 meteorological stations in diverse climatic regions. Forecasting models evaluated include autoregressive approaches, Extreme Learning Machines, and smart persistence. Results show that theoretical and empirical NICE^k values converge only when strong statistical assumptions are met (e.g., R² ≈ 1.0 for NICE^2). Most importantly, the composite metric NICE^Σ consistently outperforms conventional metrics in discriminating between models (e.g., p-values < 0.05 for NICE^Σ vs > 0.05 for nRMSE or nMAE).
Across increasing forecast horizons, NICE^Σ yields consistently significant p-values (from 10⁻⁶ to 0.004), while nRMSE and nMAE often fail to reach statistical significance. Furthermore, traditional metrics (nRMSE, nMAE, nMBE, R²) cannot reliably distinguish between models in head-to-head comparisons. In contrast, the NICE^k family demonstrates superior statistical discrimination (p < 0.001), broader variance distributions, and better inter-study comparability.
This study confirms the theoretical and empirical validity of the NICE^k framework and highlights its operational relevance. It establishes NICE^k as a robust, unified, and interpretable alternative to conventional metrics for evaluating deterministic solar forecasting models.
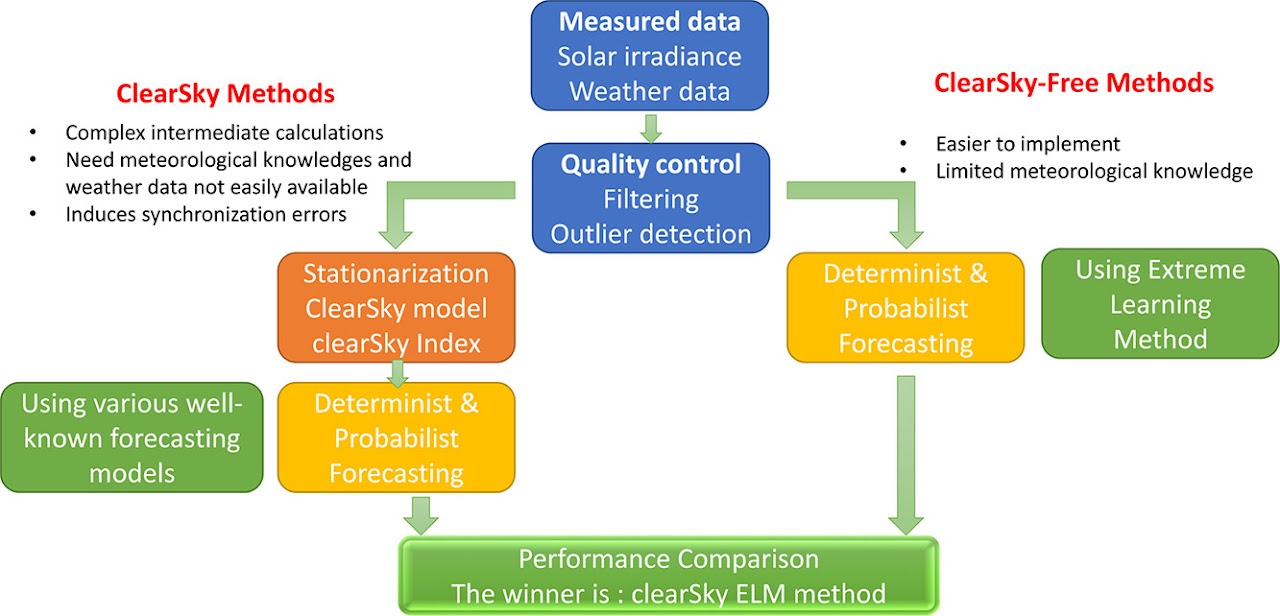
Les modèles de ciel clair servent partout en énergie solaire, mais leur usage en prévision pose des difficultés : erreurs de synchronisation, choix de l'indice de ciel clair, effets sur les scores.
Clearsky models are widely used in solar energy for many applications such as quality control, resource assessment, satellite-base irradiance estimation and forecasting. However, their use in forecasting and nowcasting is associated with a number of challenges. Synchronization errors, reliance on the Clearsky index (ratio of the global horizontal irradiance to its cloud-free counterpart) and high sensitivity of the clearsky model to errors in aerosol optical depth at low solar elevation limit their added value in real-time applications. This paper explores the feasibility of short-term forecasting without relying on a clearsky model. We propose a Clearsky-Free forecasting approach using Extreme Learning Machine (ELM) models. ELM learns daily periodicity and local variability directly from raw Global Horizontal Irradiance (GHI) data. It eliminates the need for Clearsky normalization, simplifying the forecasting process and improving scalability. Our approach is a non-linear adaptative statistical method that implicitly learns the irradiance in cloud-free conditions removing the need for an clear-sky model and the related operational issues. Deterministic and probabilistic results are compared to traditional benchmarks, including ARMA with McClear-generated Clearsky data and quantile regression for probabilistic forecasts. ELM matches or outperforms these methods, providing accurate predictions and robust uncertainty quantification. This approach offers a simple, efficient solution for real-time solar forecasting. By overcoming the stationarization process limitations based on usual multiplicative scheme Clearsky models, it provides a flexible and reliable framework for modern energy systems.
Titre original : Comparative Study of Feature Selection Techniques for Machine Learning-Based Solar Irradiation Forecasting to Facilitate the Sustainable Development of Photovoltaics: Application to Algerian Climatic Conditions
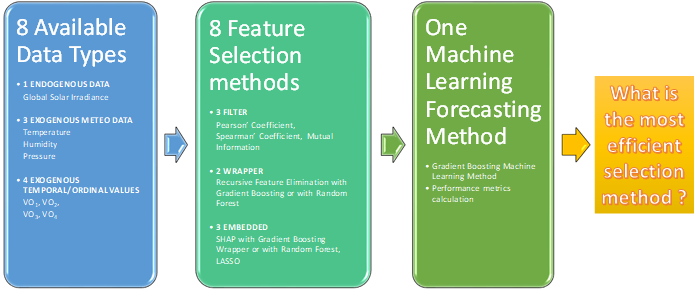
Plusieurs techniques de sélection de variables comparées pour la prévision du rayonnement solaire par apprentissage automatique, dans les conditions climatiques algériennes.
Forecasting future solar power plant production is essential to continue the development of photovoltaic energy and increase its share in the energy mix for a more sustainable future. Accurate solar radiation forecasting greatly improves the balance maintenance between energy supply and demand and grid management performance. This study assesses the influence of input selection on short-term global horizontal irradiance (GHI) forecasting across two contrasting Algerian climates: arid Ghardaïa and coastal Algiers. Eight feature selection methods (Pearson, Spearman, Mutual Information (MI), LASSO, SHAP (GB and RF), and RFE (GB and RF)) are evaluated using a Gradient Boosting model over horizons from one to six hours ahead. Input relevance depends on both the location and forecast horizon. At t+1, MI achieves the best results in Ghardaïa (nMAE = 6.44%), while LASSO performs best in Algiers (nMAE = 10.82%). At t+6, SHAP- and RFE-based methods yield the lowest errors in Ghardaïa (nMAE = 17.17%), and RFE-GB leads in Algiers (nMAE = 28.13%). Although performance gaps between methods remain moderate, relative improvements reach up to 30.28% in Ghardaïa and 12.86% in Algiers. These findings confirm that feature selection significantly enhances accuracy (especially at extended horizons) and suggest that simpler methods such as MI or LASSO can remain effective, depending on the climate context and forecast horizon.
Un article sans grand espoir cité des centaines de fois, un autre, jugé meilleur, resté dans l'ombre : après vingt ans de recherche, publier ne suffit plus, il faut être trouvé et lu.
I've experienced this troubling phenomenon firsthand: an article I had little hope for exploded with hundreds of citations, while another piece I considered my best work remained in obscurity. After twenty years of research, one thing is clear: in a rapidly evolving academic ecosystem, publishing alone is no longer sufficient.
A Saturated Ecosystem
The explosion has been brutal. In the international journals I work with, submissions have surged by over 30% in recent years. Rejection rates now reach 70% in some disciplines. Even more striking: the geography of research has been radically transformed. Where the United States dominated fifteen years ago, China now represents over 40% of global submissions in many fields.
This quantitative explosion masks deeper transformations. The emergence of AI-assisted writing tools facilitates large-scale manuscript production. Some countries have implemented financial incentives that can reach $43,000 for a publication in Nature or Science - peaks observed in China between 2008 and 2016.
The result? Between 10% and 30% of scientific articles remain uncited several years after publication, depending on the discipline. This isn't always a quality issue: it's often a discoverability problem. In this saturated environment, visibility has become a scientific skill in its own right.
Before Submission: Preparing for Discoverability
Visibility work begins well before submission. A title of 8-15 words, precise without jargon, an explicit abstract, and keywords covering the terminological variants of your field significantly improve findability via Google Scholar. Search engines first index the metadata you provide them.
Journal selection deserves strategic reflection that's often overlooked. The question isn't "which journal is most prestigious?" but "where does my audience actually read?" Publishing in a highly ranked journal but in a field distant from yours may flatter the ego, but sometimes has less impact than a second-tier journal that's central to your niche.
Metrics like CiteScore (measuring average citations over 4 years) or the "Cites per document" indicator on SCImago help choose a journal actually read by your peers. Better to publish "in the conversation" than "beside the conversation."
Open Access: A Global Opportunity
The open access movement has created unprecedented opportunities for research visibility. Repository platforms like arXiv (multidisciplinary), medRxiv (health), or EarthArXiv (Earth sciences) accelerate the circulation of ideas. In many fields, a preprint signals scientific openness, generates early feedback, and can initiate citations before formal publication.
For researchers in Europe, national agreements often allow avoiding open access publication fees. Simply linking your institutional email and ORCID identifier can automatically provide these benefits.
This "green" strategy ensures worldwide free availability of your work. Concretely: even if your article is published in a journal with a $3,000 annual subscription, anyone in the world can freely access your repository version after the embargo period.
Writing to Be Discovered
A principle I now apply: one idea equals one article, adaptable according to disciplines. Multi-subject manuscripts get lost in the crowd. I prefer short formats for targeted results - they're often more read and cited than very dense articles.
It's about doing "academic SEO": aligning title, abstract, keywords, and subheadings with your audience's typical queries. Make your figures self-sufficient with explanatory captions and clear licenses (like Creative Commons) to encourage reuse.
Systematically deposit your datasets and scripts following FAIR principles (Findable, Accessible, Interoperable, Reusable). A Data Management Plan from the beginning of a project facilitates this approach. A GitHub repository with DOI via Zenodo increases reuse and mentions, making you discoverable by completely different audiences.
For licenses, favor Creative Commons (CC-BY for example) which allows reuse with attribution. Open access isn't limited to "Green" (repository deposit) or "Gold" (direct paid publication): the emerging "Diamond" model offers free access for everyone.
After Publication: Orchestrating Dissemination
Publication day isn't the end of the story, it's the beginning of your research's public life. I now apply a reproducible plan:
Immediate: Deposit the accepted version in institutional repository with ORCID synchronization. This step takes 10 minutes and ensures permanent archiving.
Professional: Targeted announcement on LinkedIn in 3-4 sentences explaining the question your article answers, a key result, and why it matters. This is where you'll reach decision-makers and industry leaders who can transform your results into action.
General public: A short popularization post on Medium or a blog explaining the "why" and potential uses. Some research deserves to influence public debate.
Necessary vigilance: Only massively disseminate quality work - otherwise we contribute to the information noise we denounce.
Structural Solutions Needed
Beyond individual strategies, reforms are necessary. Researchers excel in fundamental research (Nobel prizes and Fields medals attest to this). But they are increasingly absent from editorial boards of major applied journals, particularly in strategic fields. Structural solutions could include:
Revising valorization policies by placing quality at the center, with minimum thresholds over 2 years rather than a quantity race
Recruiting dedicated administrative staff to free researchers from management tasks
Recognizing editorial functions in career evaluation
Training in "publication literacy" from the PhD level
In a saturated landscape where we must navigate between global quantitative explosion and quality maintenance, visibility becomes an impact multiplier. An article in a top journal is good. An article that people find, read, use, and build upon for their own research is infinitely better.
Visibility isn't academic vanity: it's the necessary condition for years of research to find their social, economic, and scientific utility.
Practical Toolkit
Before Submission
Informative title 8-15 words, abstract with audience keywords
Journal strategy: scope > blind prestige
Metadata preparation and data management
Upon Acceptance
Immediate deposit of accepted version in repository + ORCID synchronization
Preparation of dissemination versions
Post-Publication
LinkedIn for decision-makers (3-4 sentences, why important)
Quan, W., Chen, B., & Shu, F. (2017). Publish or impoverish: An investigation of the monetary reward system of science in China (1999-2016). arXiv preprint arXiv:1707.01162.
Evans, J. A., & Reimer, J. (2009). Open access and global participation in science. Science, 323(5917), 1025.
Larivière, V., Haustein, S., & Mongeon, P. (2015). The oligopoly of academic publishers in the digital era. PLOS One, 10(6), e0127502.
Tennant, J. P., et al. (2016). The academic, economic and societal impacts of Open Access. F1000Research, 5, 632.